After a broadcast is sent, performance and revenue data become available in the analytics view. These metrics reflect how recipients interacted with the email and include opens, clicks, unsubscribes, and attributed revenue. Analytics are updated in real time and are available for each sent broadcast. This article outlines where to find this data and how to review the results.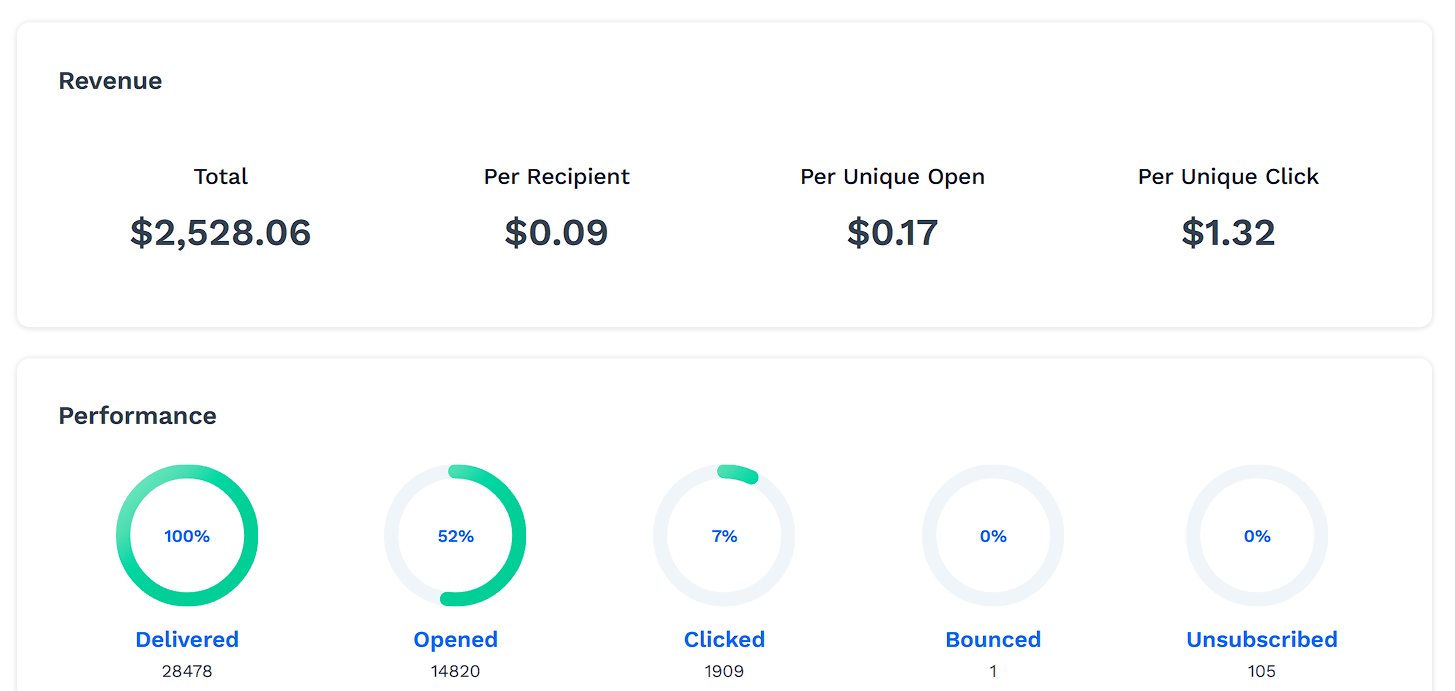
IMPORTANT
After sending your broadcasts, broadcast performance data will start populating. Please note that there may be a slight delay before seeing the statistics.
Requirements
An active ClickFunnels account
A sent Broadcast campaign
Access Broadcast Analytics
In your ClickFunnels dashboard, go to the Email app from the left-hand menu.
On the Broadcasts page, locate and click the name of any sent broadcast.
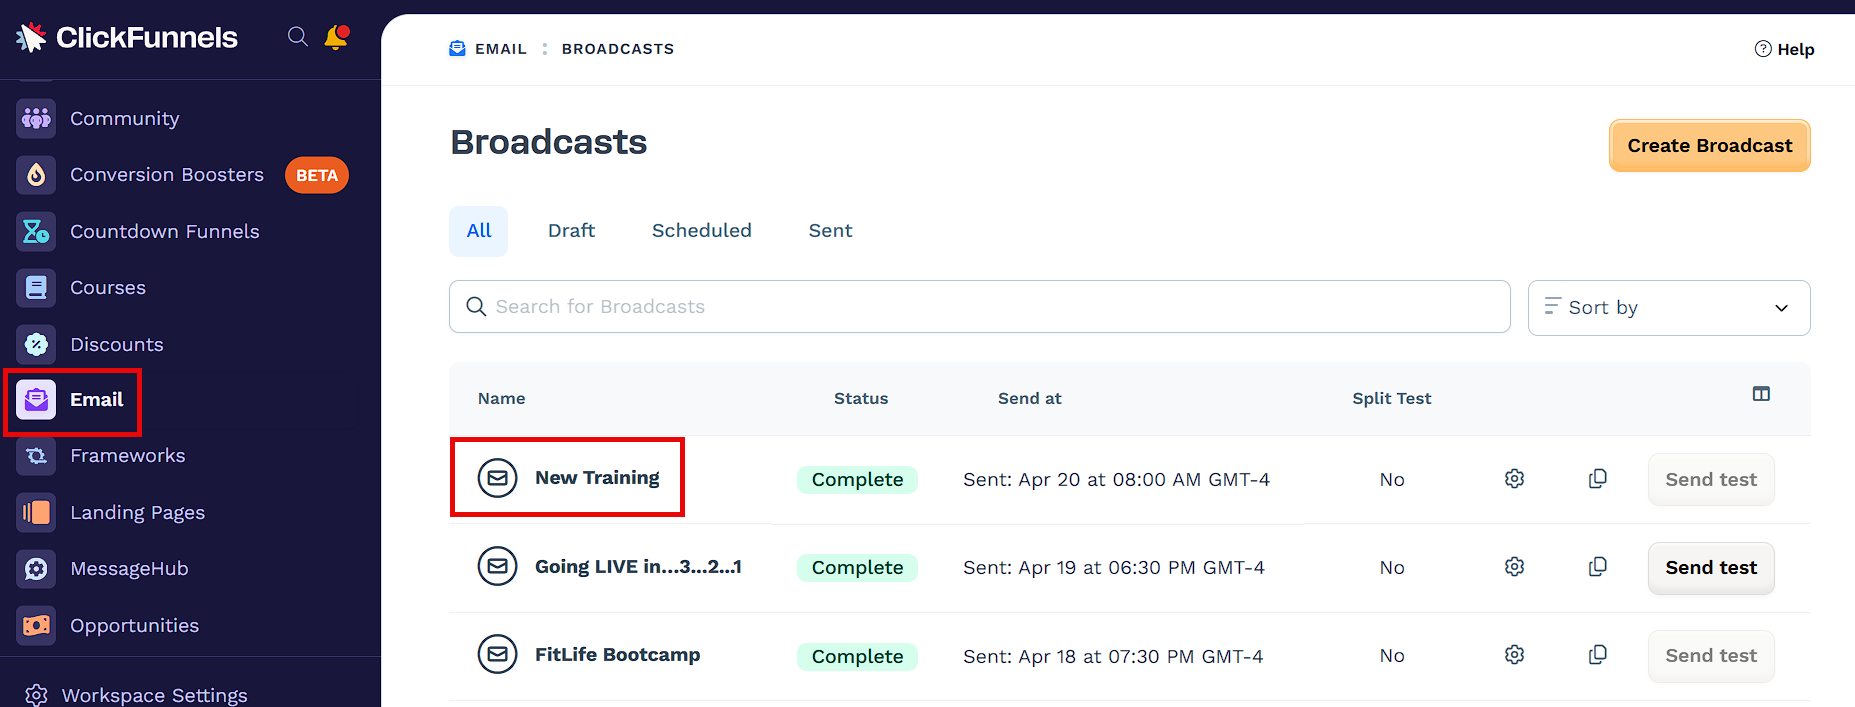
The analytics view will open, where key results and tracking data are available.
Subject Line Split Test
When a broadcast includes a subject line split test, the results appear near the top of the analytics screen. This section displays how each subject line variation performed during the test and which version was selected as the winner.
Split tests help determine which subject line is more effective at encouraging opens. This allows for data-based optimization without requiring multiple sends.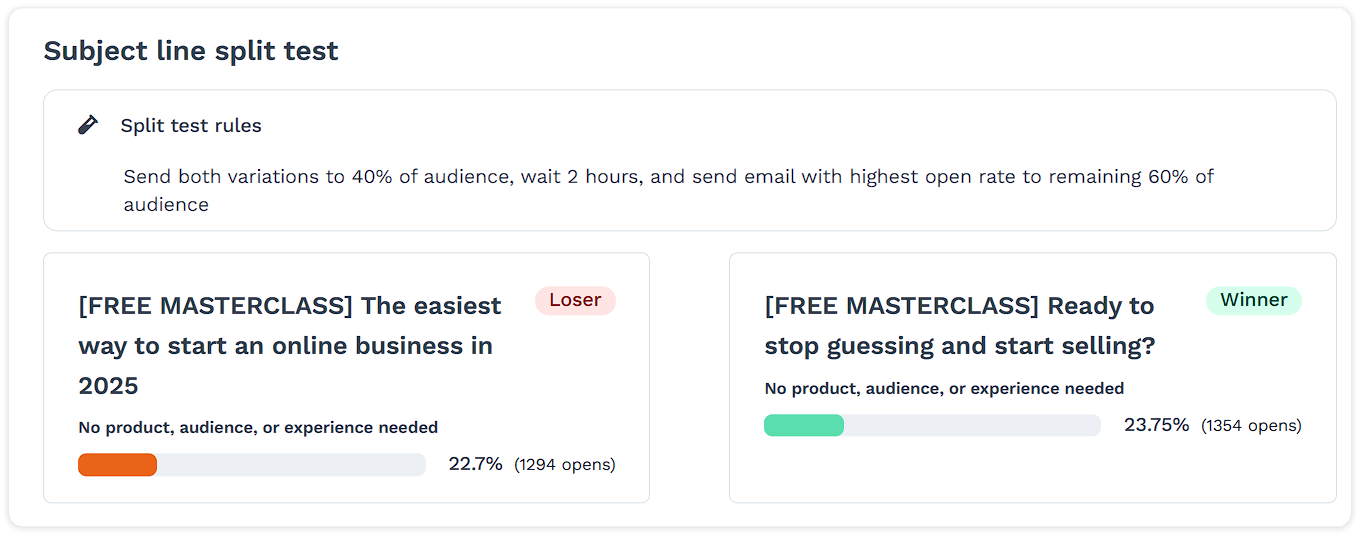
Split test rules
The split test is applied to a portion of the audience before the full email is delivered. The system automatically:
Sends each subject line variation to a test group
Waits a set amount of time to collect open rate data
Sends the higher-performing subject line to the remaining audience
Results view
The split test section shows:
Both subject line variations used in the test
Open rate percentage and number of opens for each version
A label indicating which version was selected as the Winner
The other version marked as Loser
These results are available only for broadcasts where subject line testing was enabled before sending.
Revenue Stats
The Revenue section in Broadcast lets you track the income generated from your emails. By analyzing this data, you can see how your broadcasts contribute to sales, giving you insights to improve your email strategy.
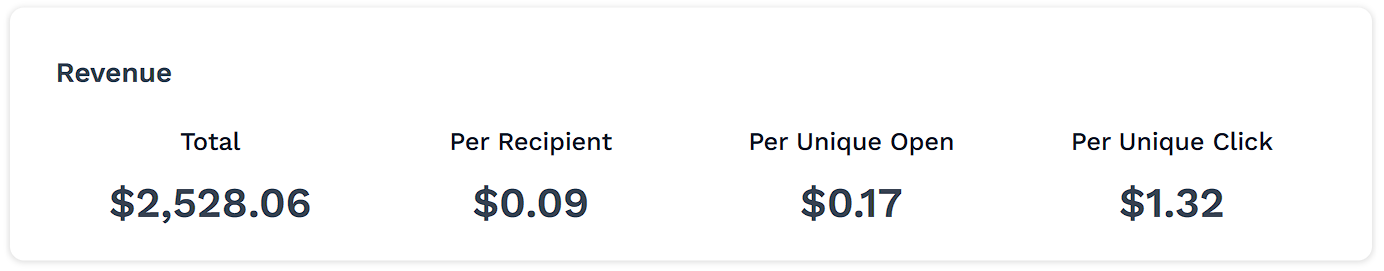
Total: The total revenue generated from the email broadcast.
Per Recipient: The approximate revenue generated per recipient.
Per Unique Open: The approximate revenue generated for every unique recipient who opens the email broadcast.
Per Unique Click: The approximate revenue generated for every unique click.
Performance Stats
The Performance section in Broadcast helps you gauge how effectively your email is engaging your audience. Analyzing performance metrics such as Delivered, Opened, Clicked, Bounced, and Unsubscribed provides valuable insights for refining your email strategy and boosting audience engagement.
Delivered: The total number of successfully delivered broadcasts and the corresponding percentage.
Opened: The number of recipients who opened the broadcast email, along with a visual representation displayed as a percentage. It’s a crucial indicator, signaling the initial engagement and interest in your email.
Clicked: The number of recipients who clicked on the links in the broadcast email. Additionally, it displays the Click-Through Rate (CTR), which measures the effectiveness of the email in prompting recipients to take action by clicking on a specific link or button.
Bounces: This shows the number of email addresses where the broadcast email couldn’t be delivered. This can occur if the email address is invalid, mistyped, or the mail server is not responding. It’s also displayed as a percentage.
Unsubscribed: The number of recipients who have chosen to unsubscribe from receiving further broadcast emails.
Open Stats:
Total opens: The total number of times the broadcast email has been opened, including multiple opens by the same recipient.
Unique Opens: The number of times individual recipients have opened the broadcast email. It counts each recipient only once, regardless of how often they open the email.
Average Time to Open in Minutes: The average time it takes recipients to open and view your email after it has been delivered to their inbox.
Click Stats:
Total Clicks: The total number of clicks on the links within the broadcast email, including multiple clicks by the same recipient. It measures the overall engagement of your email recipients with the content and calls to action (CTAs) in your email.
Unique Clicks: The number of individual recipients who have clicked a link within the broadcast email at least once. It counts each recipient only once, regardless of how often they open the email.
Average Time to Click in Minutes: The average time it takes recipients to click a hyperlink or a call to action (CTA) after it has been delivered to their inbox.
Accessing Contact Information Via Performance Metrics
In addition to tracking email performance metrics, ClickFunnels allows you to access individual contacts associated with those metrics. This feature provides deeper insights into your audience’s interaction with broadcasts. Let’s explore how you can easily access this valuable information.
Open a complete broadcast and navigate to the Performance section.
Click on the name of the performance metric you’re interested in, such as
Delivered,Opened, etc.
In the side menu, you can view the corresponding contacts.