The Analytics Overview Dashboard shows key performance data for your funnels. It helps track orders, opt-ins, pageviews, and conversion rates in one place. Businesses can use these insights to measure marketing efforts, identify trends, and make better decisions.
This article explains what the Overview Dashboard is, how to read the data, and how to use its features to monitor performance.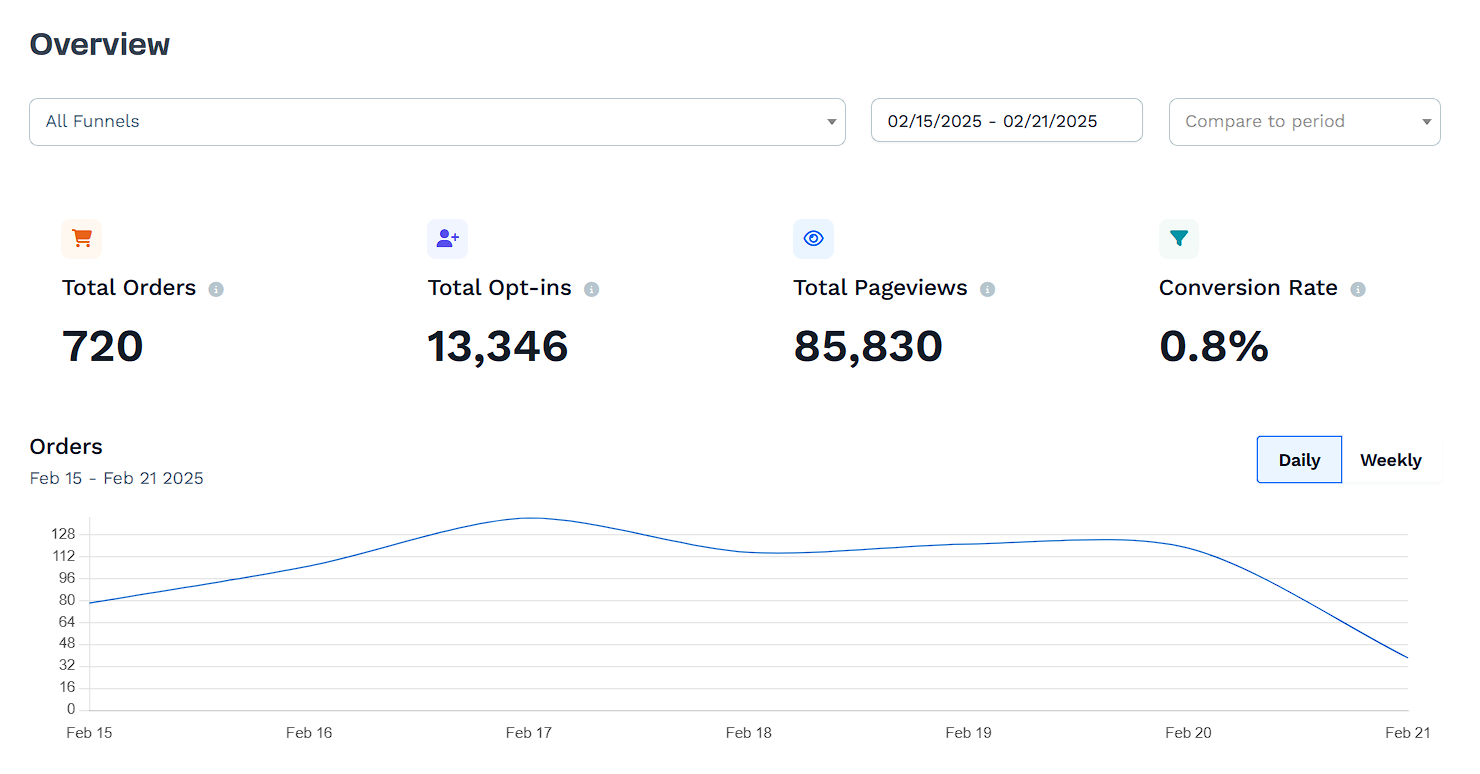
Requirements
An active ClickFunnels account
Understanding the Analytics Overview Page
The Analytics Overview is the main analytics page where you can track how well your funnels are performing. It provides key data on total orders, opt-ins, pageviews, and conversion rates, helping you measure how many people visit your funnels, sign up, and make purchases.
Understanding these numbers is important for making informed decisions. If you see a high number of opt-ins but low orders, this may mean your offer isn’t converting well, and you might need to adjust your pricing, messaging, or checkout process. If your pageviews are high but opt-ins are low, your landing page might need a stronger call-to-action or a more compelling offer.
Regularly checking the Analytics Overview helps you spot trends, identify potential issues, and adjust your funnels to improve engagement and sales. Without this data, you’re making decisions blindly, which can lead to missed opportunities for growth.
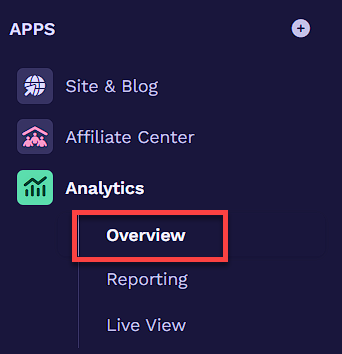
Accessing the Analytics Overview
To open the Analytics Overview page, follow these steps:
In the left menu, find Analytics under the APPS section.
Click Overview to open the main analytics page.
Understanding Key Metrics and Sales Data
The Analytics Overview provides a breakdown of important performance metrics, including orders, opt-ins, pageviews, and conversion rates. Below these numbers, additional insights such as total product sales, opt-in sources, and customer distribution help analyze where revenue and leads are coming from.
Each section plays a role in understanding how your funnels are performing:
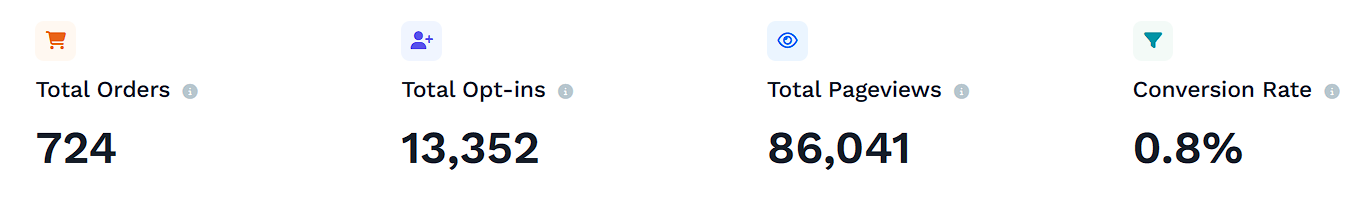
Performance Metrics
Total Orders: The number of completed purchases in the selected date range.
Total Opt-ins: The number of people who signed up through your funnels.
Total Pageviews: The total number of times your funnel pages were visited.
Conversion Rate: The percentage of visitors who took a desired action, such as opting in or purchasing.
Orders Chart
Below the key metrics, there is a chart that visually tracks performance over time. This chart updates based on the selected metric—Orders, Opt-ins, or Pageviews—allowing you to see trends for different aspects of your funnel. The data can be displayed in Daily or Weekly view: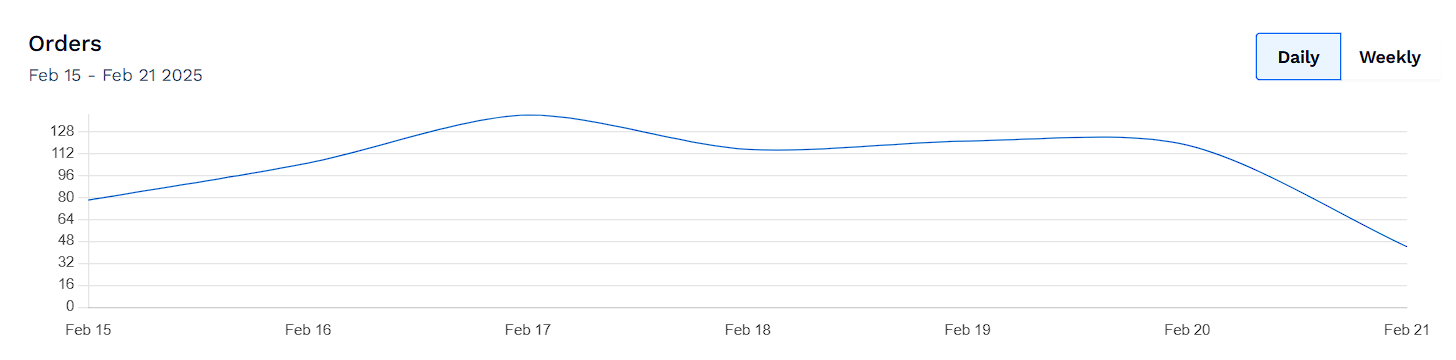 For example:
Selecting Orders will show how many purchases were made each day.
Selecting Opt-ins will display the number of leads collected over time.
Selecting Pageviews will indicate how traffic fluctuates across your funnel pages.
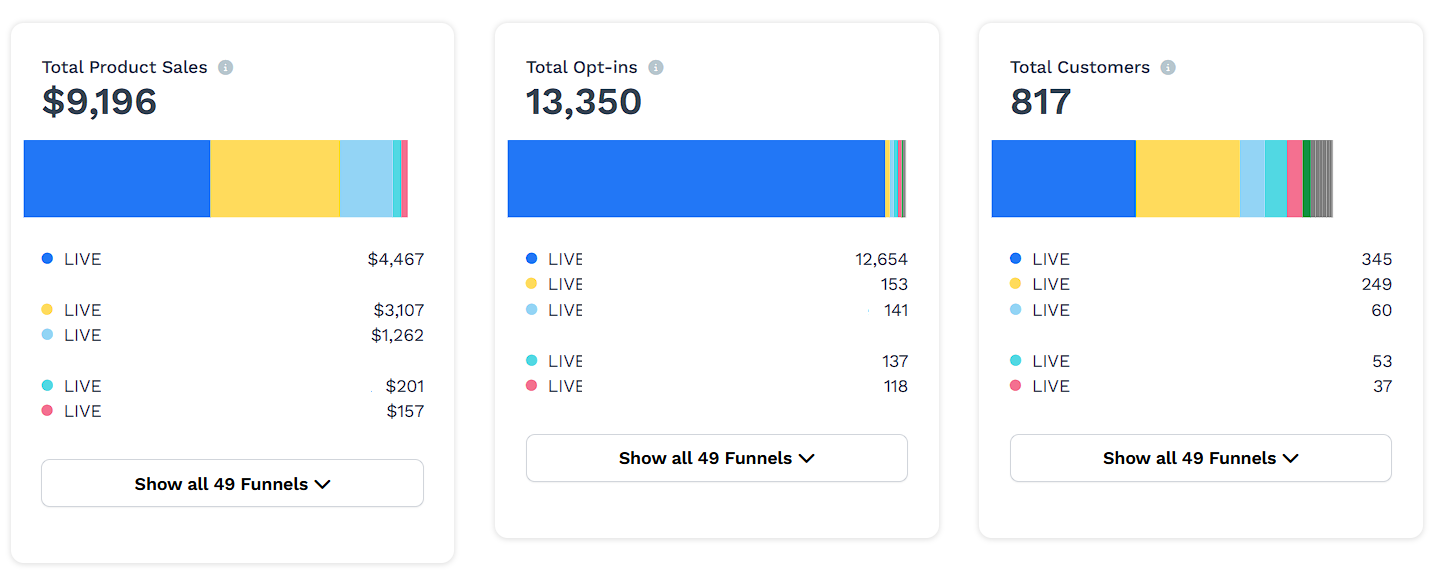
Sales and Customer Data
Total Product Sales: The total revenue generated by all funnels, with a breakdown of earnings per funnel.
Opt-in Distribution: A chart showing which funnels are generating the most opt-ins.
Total Customers: The number of unique customers, with a breakdown by funnel.
How to View and Analyze Data
The Analytics Overview allows you to customize the data displayed by adjusting the date range, funnel selection, and comparison options. Understanding how to use these features ensures you get the most relevant insights for your business.
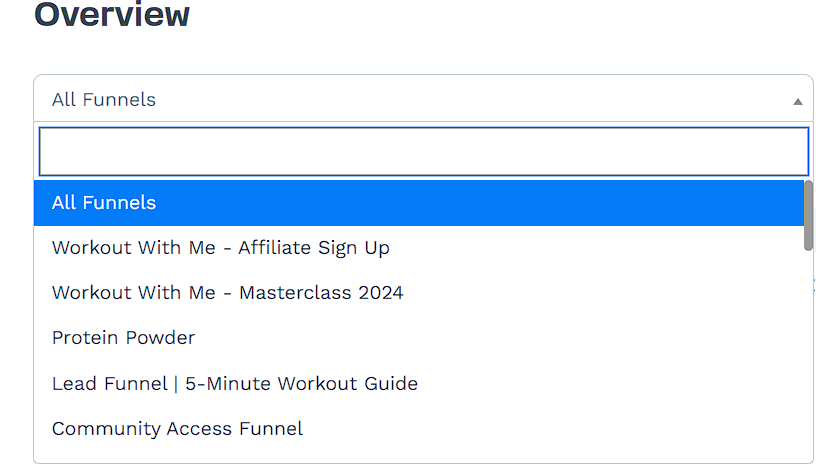
Filtering by Funnel
By default, the Overview displays data for all funnels, but you can filter to see performance for a specific funnel.
Click the "All Funnels" dropdown at the top.
Select a specific funnel from the list.
The metrics and charts update to reflect only that funnel’s data.
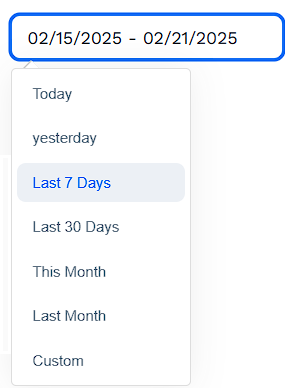
Selecting a Date Range
The date selector at the top of the page lets you view data for a specific period.
Click the date range field in the top-right corner.
Choose a predefined range (such as "Last 7 Days") or select a custom date range.
The Overview updates to display data for the selected period.
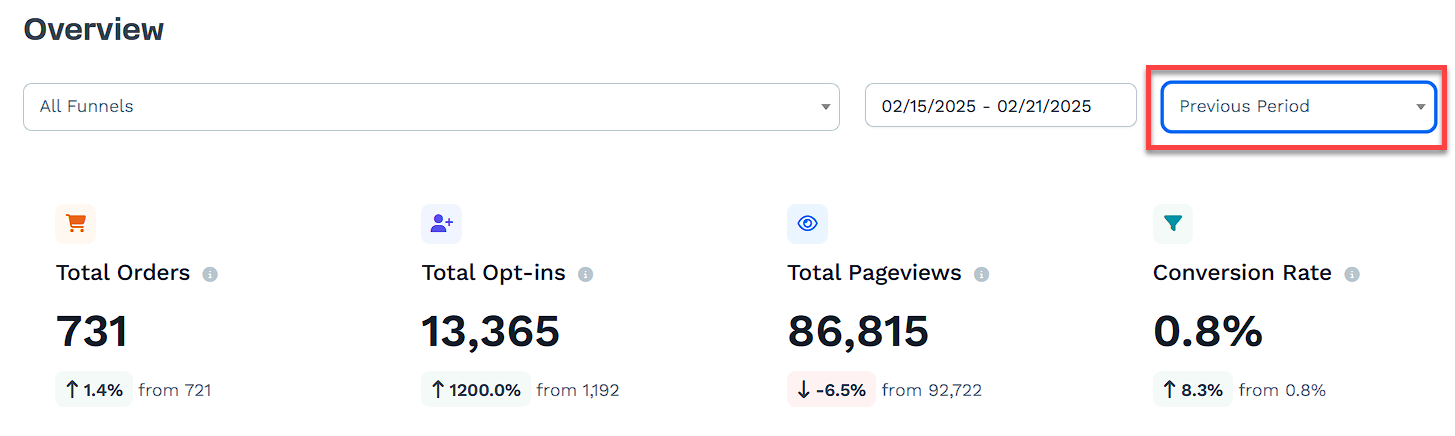
Comparing Performance to Another Period
The Compare to Period feature lets you compare your current performance to a past time frame.
Click Compare to Period next to the date range.
Choose a previous period (such as the same week from the previous year).
The Overview updates to show side-by-side comparisons.