Tracking performance is essential for making informed business decisions. The Reporting page provides detailed insights into sales, opt-ins, pageviews, subscriptions, and course progress. These reports help measure results across different areas of your business, making it easier to identify trends and opportunities.
Understanding this data can improve marketing strategies, optimize funnels, and increase revenue. This article explains how to access reports, adjust filters, and analyze key metrics to make better business decisions.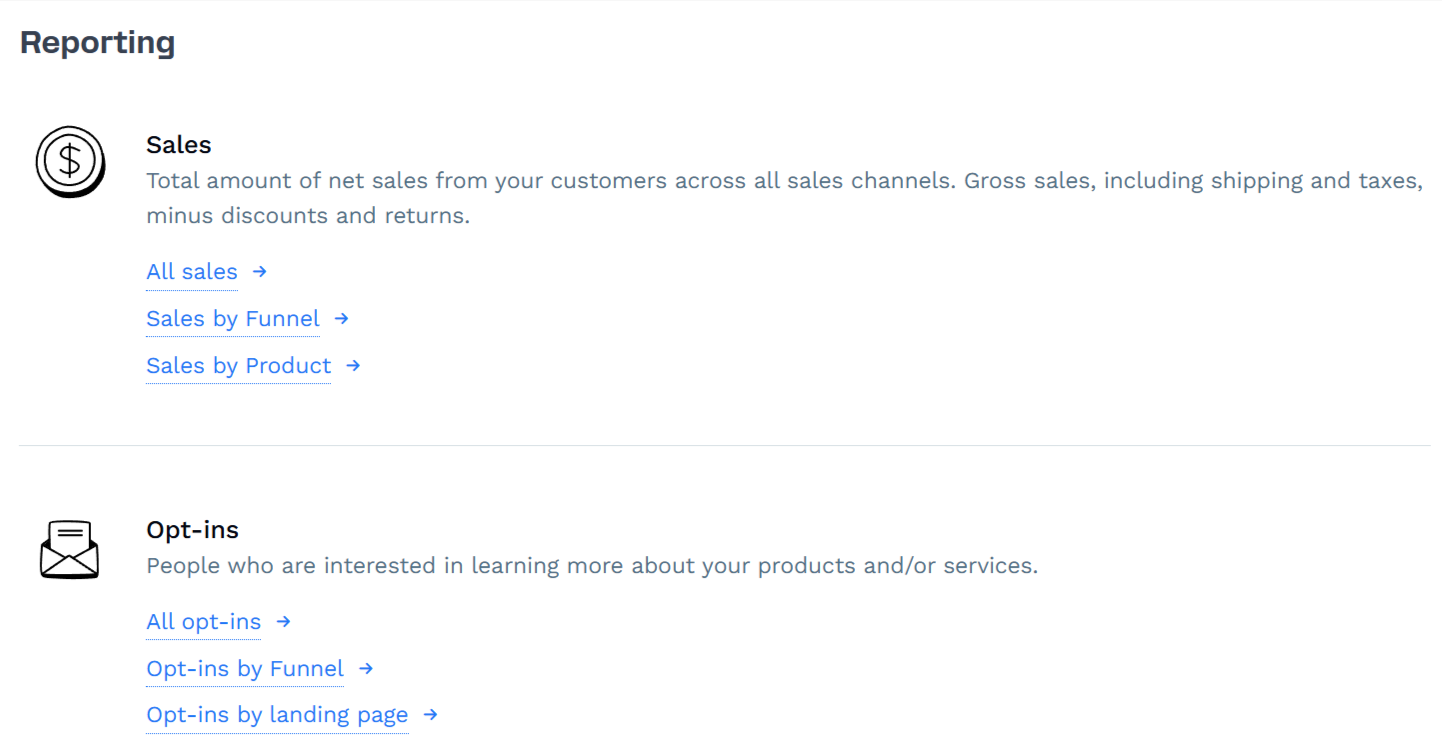
Requirements
An active ClickFunnels account
Accessing the Reporting Page
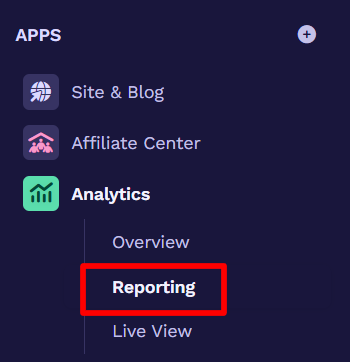
The Reporting page is located in the Analytics app section of the ClickFunnels dashboard. To access it:
In the left-hand menu, find Analytics under the APPS section.
Click Reporting to open the page.
Once inside, you will see different report categories, such as Sales, Opt-ins, Pageviews, Subscriptions, and Course Progress. Clicking on any category will open a detailed report with filtering and data analysis options.
Understanding the Available Types of Reports
The Reporting page provides insights into different aspects of your business, helping you track performance and make data-driven decisions. It includes several available types of reports, each focusing on key metrics that impact revenue, customer engagement, and marketing effectiveness.
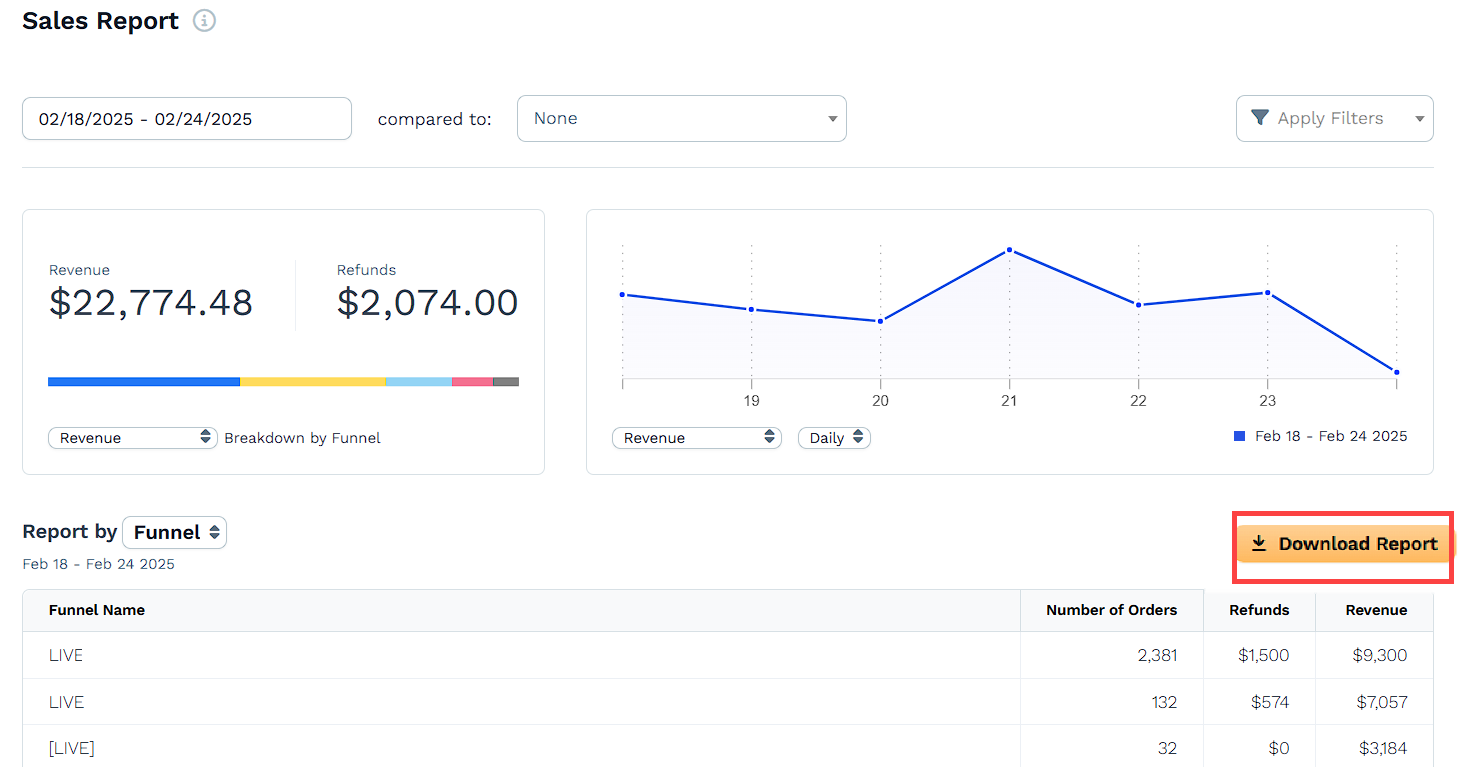
Sales Reports
Sales reports track the total amount of net sales, including purchases made across all funnels. These reports can help analyze revenue trends, identify best-selling products, and measure overall sales performance.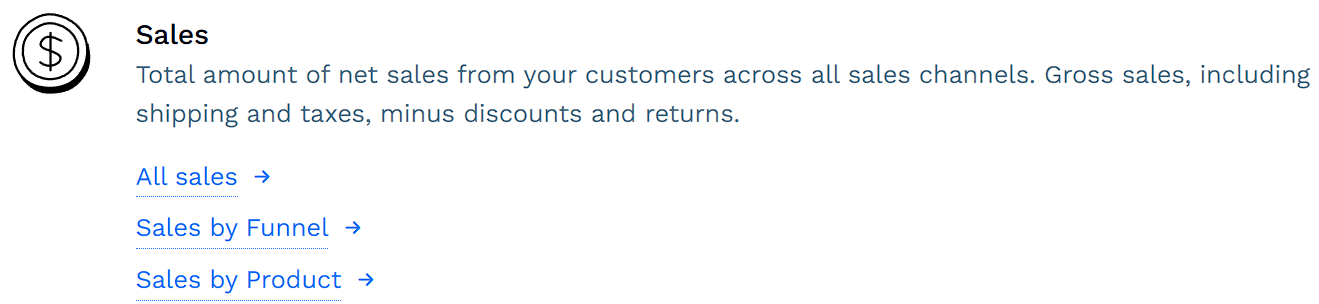
All Sales: Displays total sales across all funnels and products.
Sales by Funnel: Breaks down revenue per funnel, helping compare performance.
Sales by Product: Shows which products generate the most revenue.
Opt-in Reports
Opt-in reports track the number of leads collected through funnels and landing pages. These reports help evaluate the effectiveness of lead generation efforts.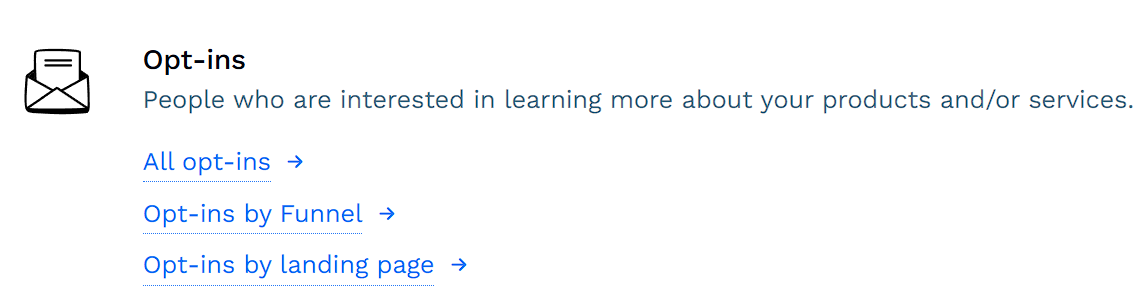
All Opt-ins: Displays the total number of opt-ins across all funnels.
Opt-ins by Funnel: Breaks down opt-ins per funnel to show which funnels generate the most leads.
Opt-ins by Landing Page: Tracks which landing pages are driving the highest number of signups.
Pageview Reports
Pageview reports measure visitor activity across funnels and pages. These reports help understand how users interact with different pages and where traffic is highest.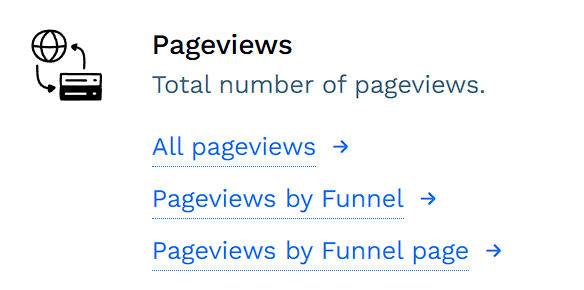
All Pageviews: Displays total pageviews across all funnels.
Pageviews by Funnel: Shows how much traffic each funnel receives.
Pageviews by Funnel Page: Breaks down traffic per page within a funnel.
Subscription Reports
Subscription reports track recurring revenue and trial signups. These reports are useful for businesses with membership plans or subscription-based products.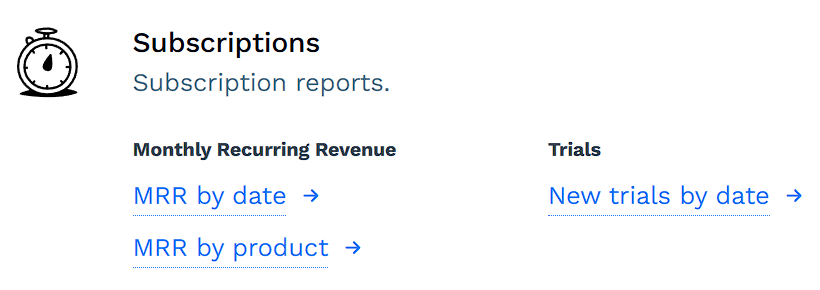
MRR by Date: Tracks Monthly Recurring Revenue (MRR) over time.
MRR by Product: Displays recurring revenue broken down by product.
New Trials by Date: Shows how many new trial signups occurred within a selected period.
Course Progress Reports
Course progress reports track customer engagement with online courses. These reports help monitor student progress and identify courses with the highest completion rates.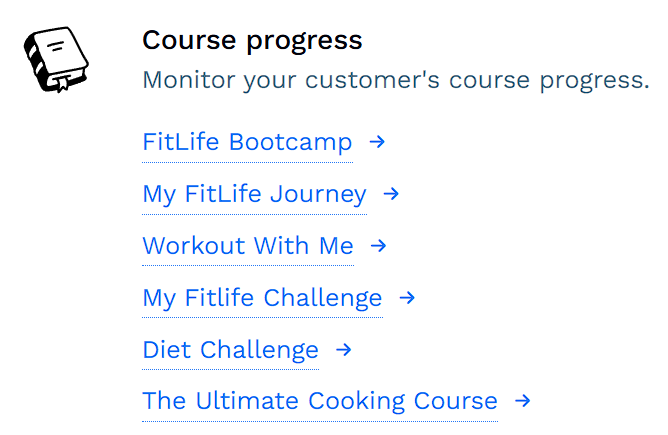
Displays a list of courses available in the account.
Clicking on a course takes you to its dashboard, where you can view student progress and engagement.
Using Reporting Features
To analyze data, you first need to access a specific report from the Reporting page. Once inside a report, you can adjust filters, select date ranges, and compare data to gain deeper insights into your funnel performance.
Selecting a Date Range
Each report allows you to choose a specific time frame to analyze performance over different periods.
Click the date selector at the top of the report.
Choose a predefined range (such as "Last 7 Days") or select a custom start and end date.
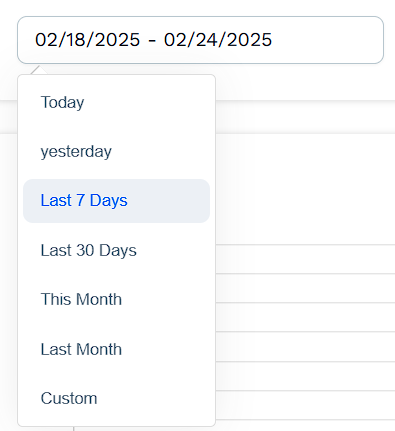
The report updates to display data for the selected period.
💡 Use this feature to track short-term trends or measure long-term growth.
Comparing Data
Some reports offer a comparison feature to analyze current performance against a previous period.
Click the "vs" dropdown next to the date selector.
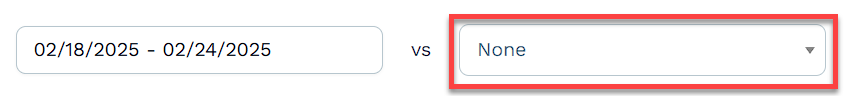
Select the previous time frame you want to compare.
The report updates to show percentage increases or decreases alongside the current data.
💡 This helps spot trends, seasonal changes, or the impact of recent optimizations.
Applying Filters
Filters help narrow results based on specific criteria, such as funnels, products, or landing pages. You can select up to 5 items at a time, depending on what the filter dropdown allows in that report.
Click the filter dropdown (if available) in the report.
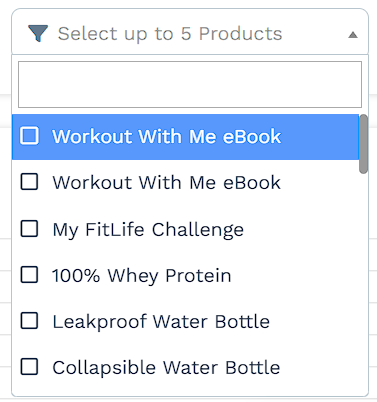
Select one or more options to refine the data.
The report will automatically update to show only the results that match your selected filters.
💡 Filters are useful for comparing different funnels, identifying high-performing pages, or analyzing specific products.
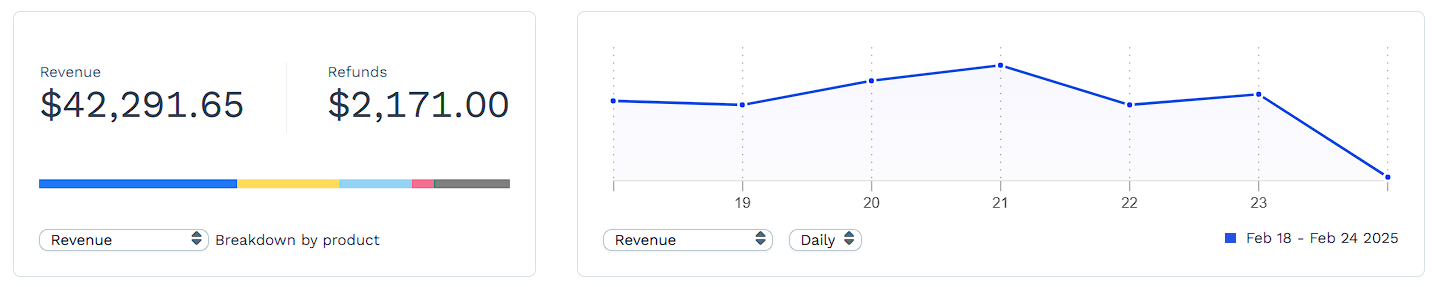
Reading Graphs and Tables
Reports include visual graphs and detailed data tables to help interpret performance trends.
Graphs provide an overview of how key metrics change over time.
Tables list specific data points, such as individual product sales, opt-ins per page, or trial signups per day.
💡 Use graphs to quickly identify patterns and tables for deeper analysis of specific metrics.
Exporting Reports (If applicable)
If an export option is available, users can download reports for further analysis.
Click the Download Report button (if present).
The file will be downloaded automatically in CSV format.